
VIAS Program
The sector measures effort,not results.
The VIAS Program combines an immersive virtual reality experience with a dashboard that shows what changed in participants' risk perception, right after and 15 days later.
Every educational action becomes data to decide the next one: what to repeat, with which audience and where to adjust.
- Tailored VR simulator
- D0 and D15 survey
- Live dashboard
VIAS Variação de Intenção, Autoeficácia e Sensibilidade ao risco (variation in intention, self-efficacy and risk sensitivity)
Data that guides the next action.
Answers flow into a live dashboard, broken down by audience, age, region and unit. It is the new data layer to renew educational actions with intelligence.

The dashboard guides three decisions
- 01What is worth repeating.
- 02With which audience and in which region.
- 03What needs to be adjusted.
- Immediate Impact
- The variation right after the experience.
- Impact Retained at D15
- What remained fifteen days later.
- Retention Rate
- The share of the impact that stayed.
Today the report counts people. It doesn't show what changed in them.
Highway concessionaires, cities and fleets invest in road safety education every year. At the end of the campaign, the report shows how many people took part. What changed in them remains unanswered.
- 01
The report only shows reach
Number of participants and photos of the action. Nothing about what changed in their perception.
- 02
Next year's budget lacks evidence
Without data on effect, renewing or adjusting the campaign becomes a matter of opinion.
- 03
ESG and safety reports ask for indicators
Sustainability and road safety reports demand results. Counting people does not support that.
- 04
The campaign becomes more of the same
Without knowing which message worked with which audience, the next action repeats the last one.
The human factor is the layer that still has no gauge.
- R$ 647k
- Average cost of a fatal crash on Brazilian federal highways.
- Source: IPEA e PRF
- 13,477
- Motorcyclists killed in Brazilian traffic in 2023.
- Source: Atlas da Violência 2025, IPEA and FBSP
- 38.6%
- Of traffic deaths in Brazil in 2023 were motorcyclists.
- Source: Atlas da Violência 2025, IPEA and FBSP
Every indicator available today comes after the crash.
Cinema to move. Science to measure.
- 01
Inform
Traditional campaigns inform. Drivers already know what is right and still believe the risk belongs to others.
- 02
Live
In virtual reality, they live the consequence of a wrong decision, safely. The body learns through emotion.
- 03
Measure
Right after and fifteen days later, the survey shows what changed in risk perception and what remained.
Experiences that make people feel the risk.
Each experience is tailored to the road, the audience and the risk: collision, motorcycle, pedestrian, phone at the wheel, sleep and fatigue.
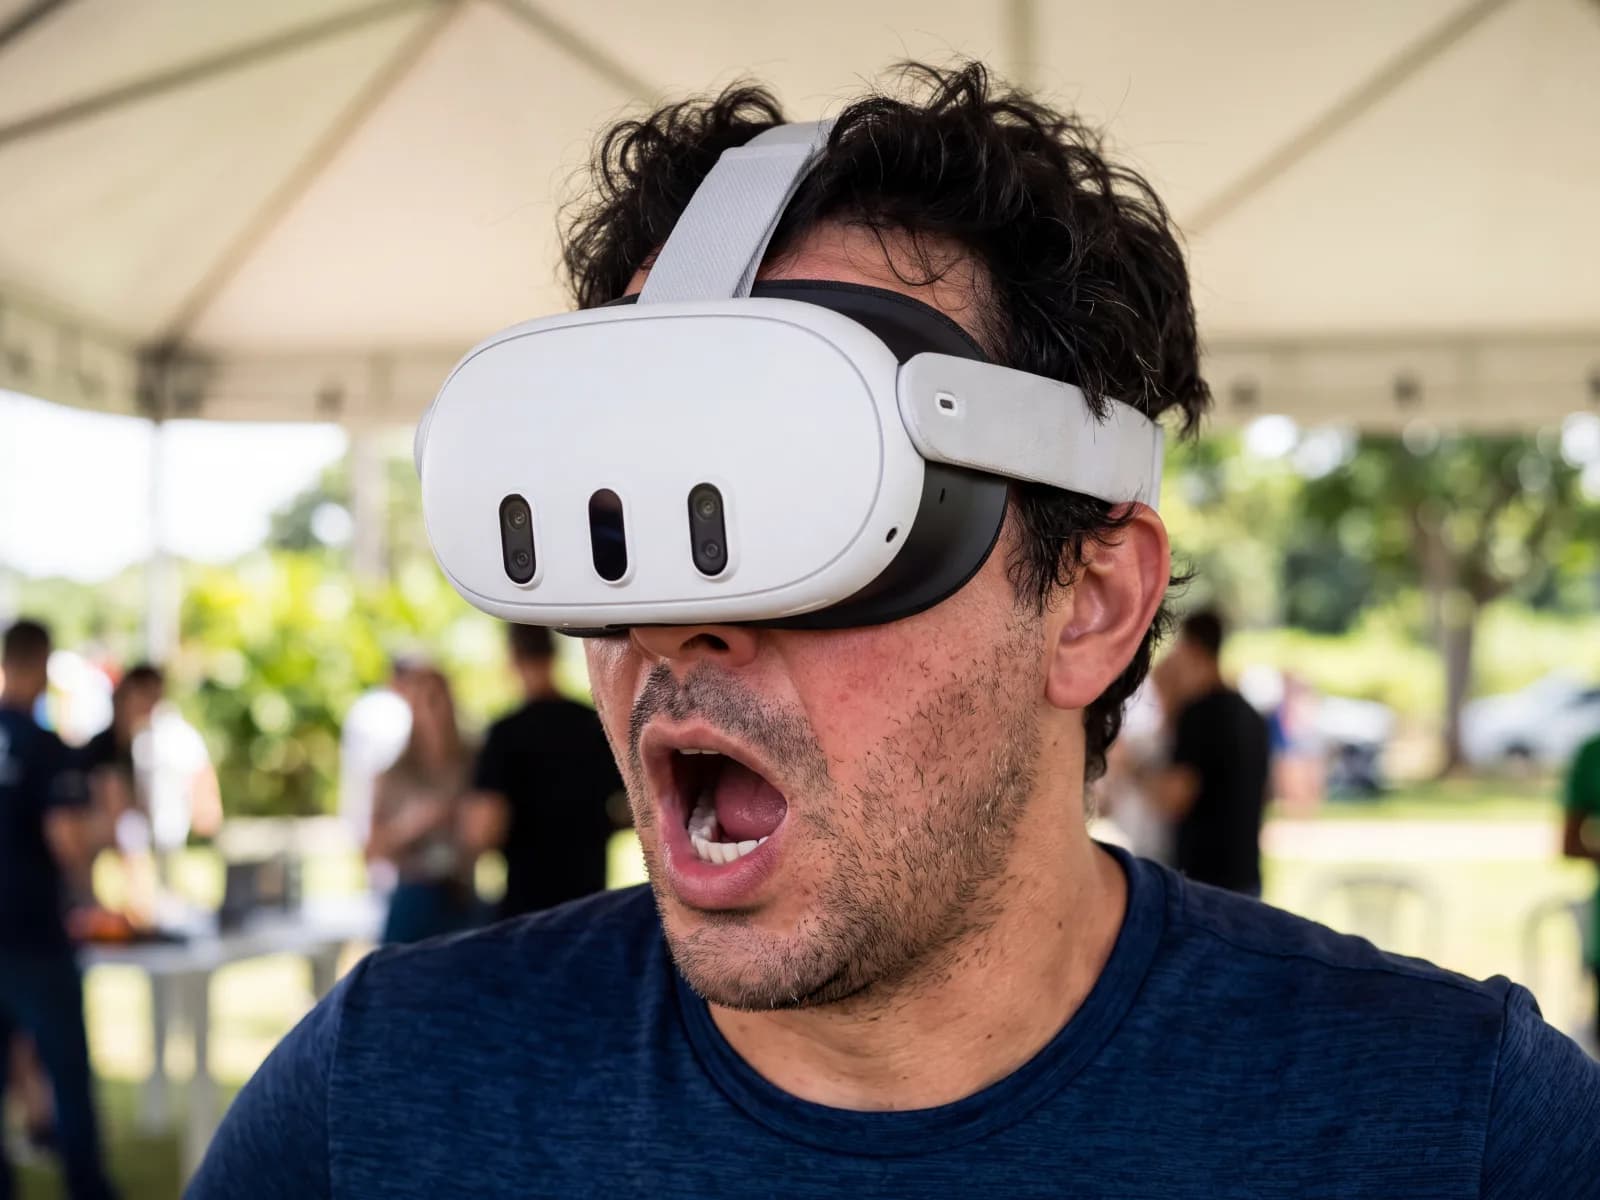
Portable virtual reality
Takes the experience to toll plazas, rest stops, events, companies and schools.
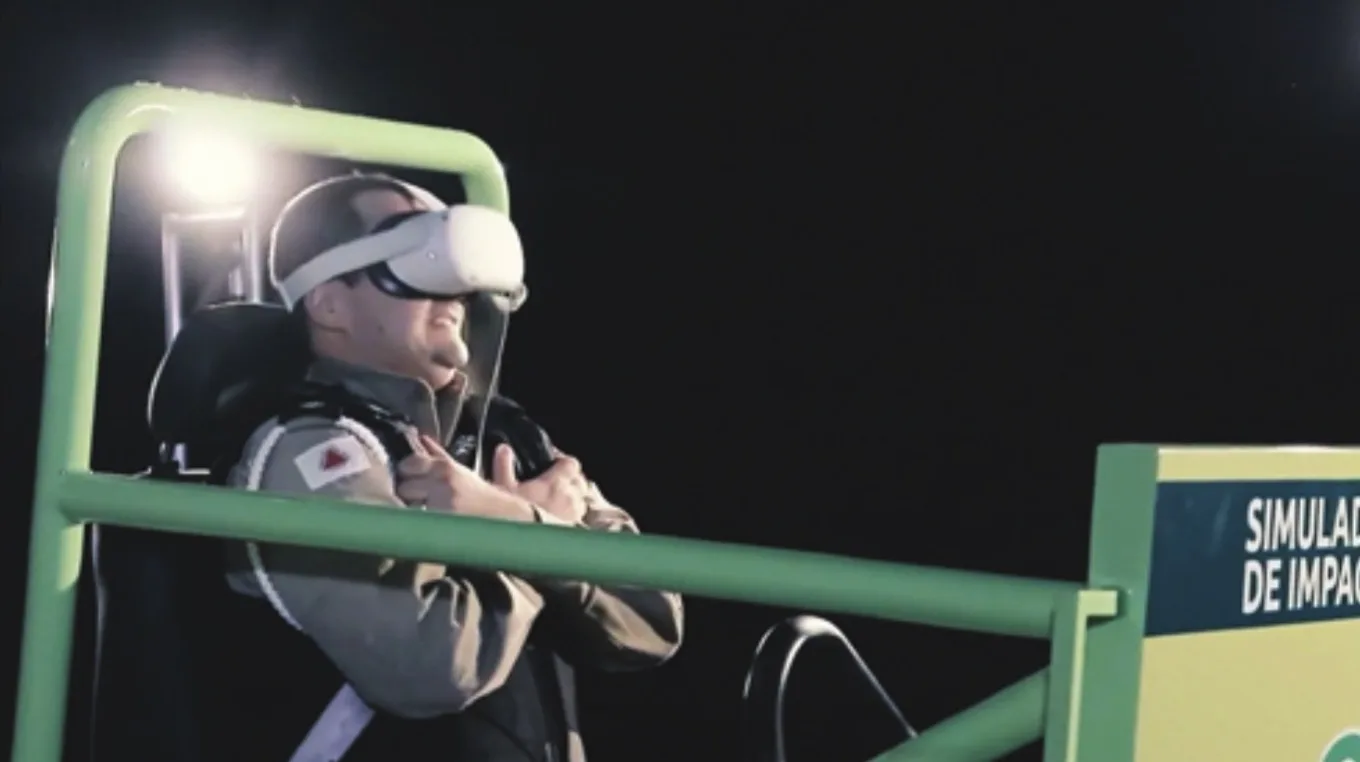
Impact simulator
A physical seat with a seat belt that reproduces the deceleration of a collision, along with the virtual reality scene.
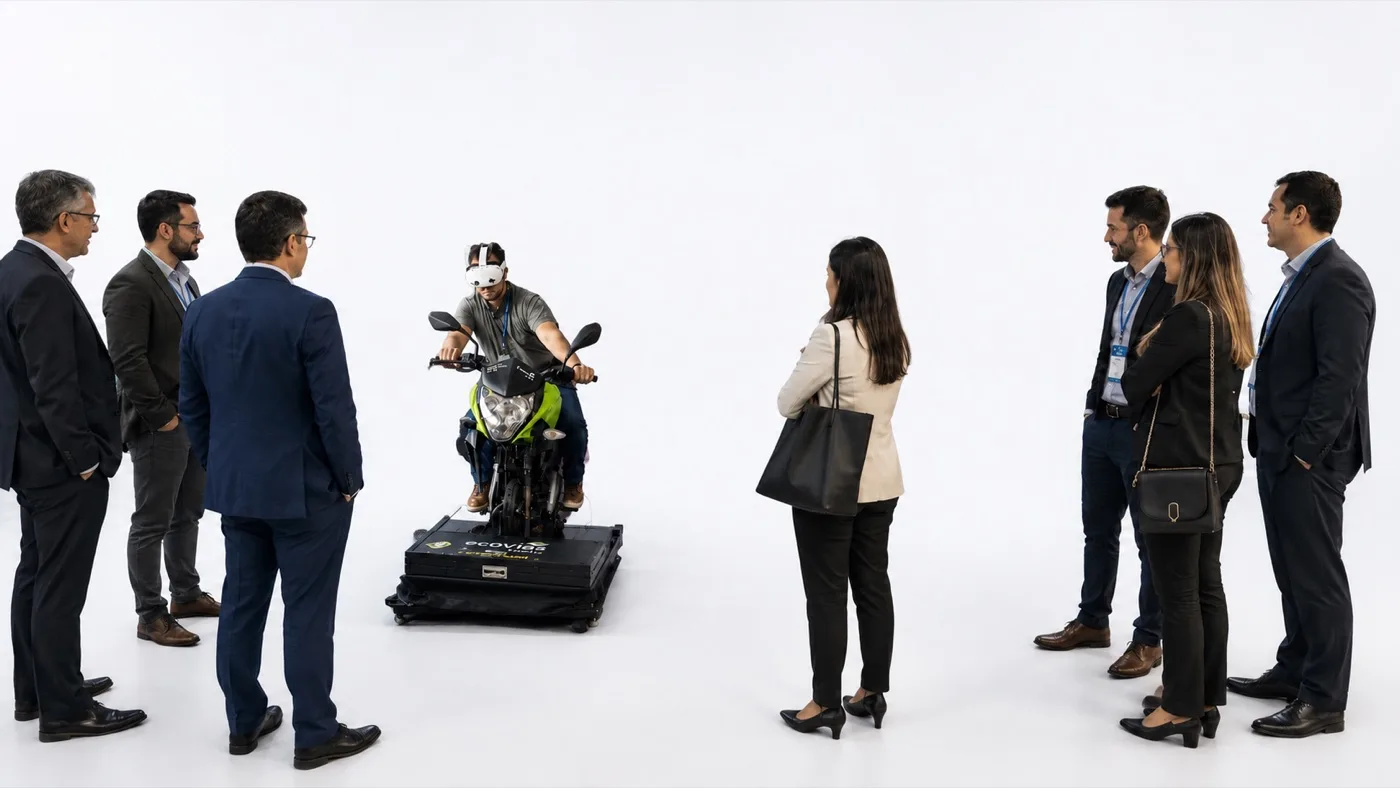
Electronic motion platform for the motorcycle simulator
A motorcycle on a motion platform integrated with virtual reality, for one of the most exposed audiences in traffic.
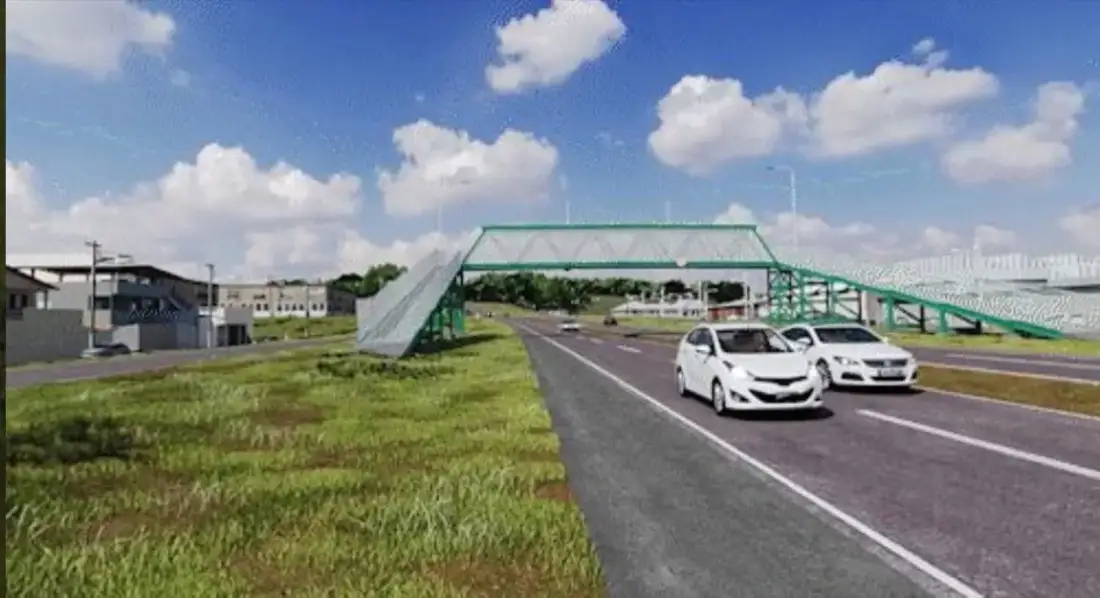
The road he recognizes.
The virtual scenario is modeled after the real highway. The participant travels through a place they know, not a generic road.
Drag the divider to compare.
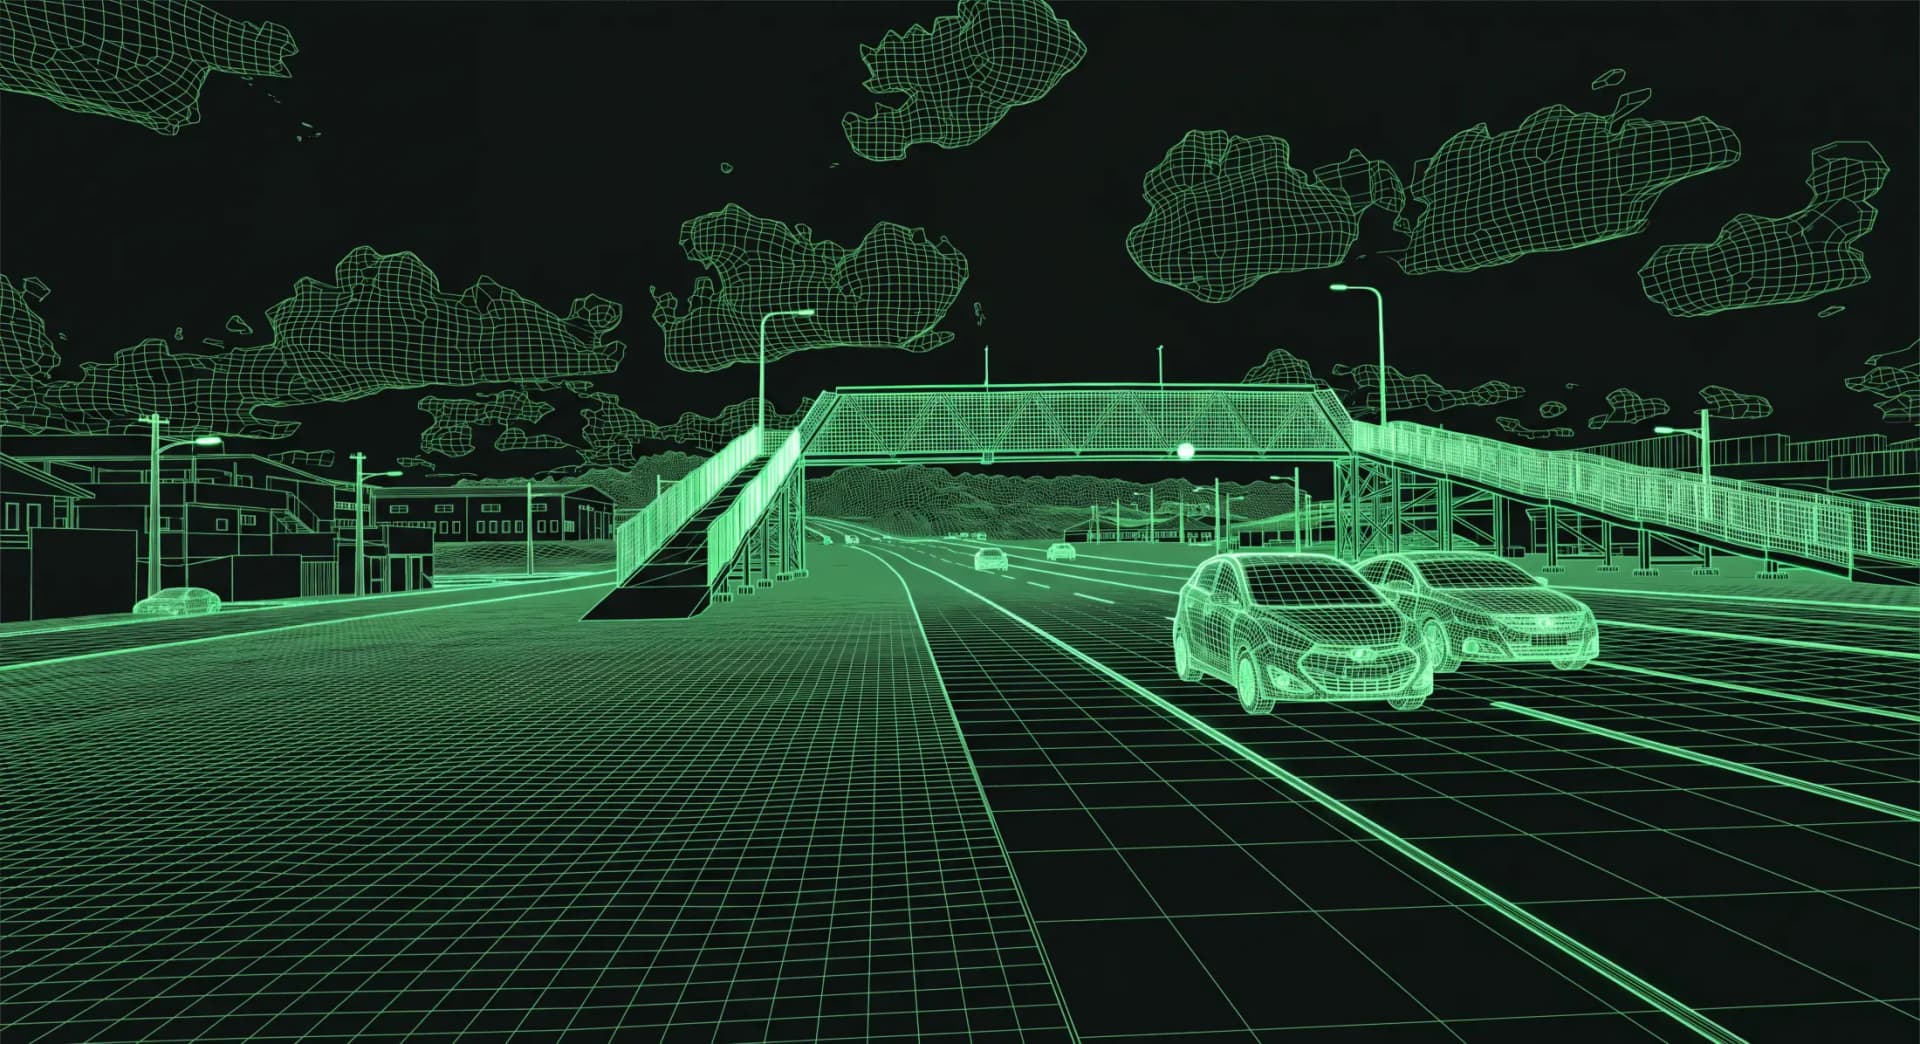
Cases that become references.
Tailored projects for highway concessionaires, each one for a specific audience and risk.
Less than 2 minutes on the phone. No app.
Right after the experience, the participant scans a QR code and answers a short survey. Fifteen days later, the same survey arrives on WhatsApp.

- D0
Right after the experience
The participant rates how they feel now and, in retrospect, how they thought before. All in the same session, avoiding the bias of answering before living the experience.
- D15
Fifteen days later
The same survey arrives on WhatsApp. The difference between D0 and D15 is the Awareness Delta: how much of the impact remained.
Three dimensions measured
Risk perception
How much the person recognizes the risk for themselves, not only for others.
Self-efficacy
How capable they feel of acting differently next time.
Declared intention
How much they intend to change their own attitude in traffic.
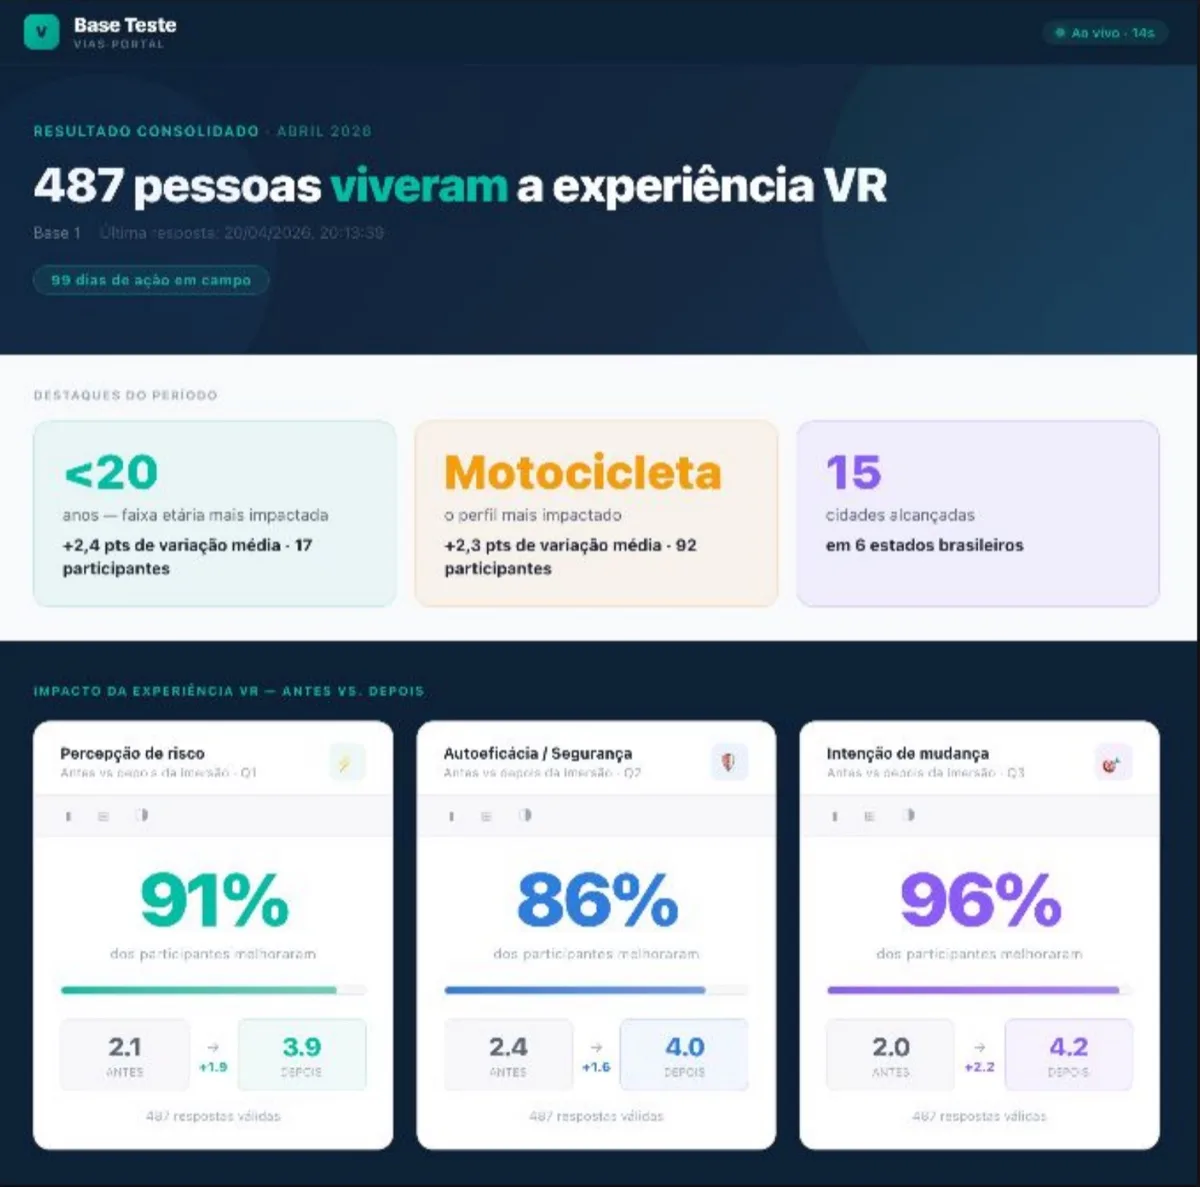
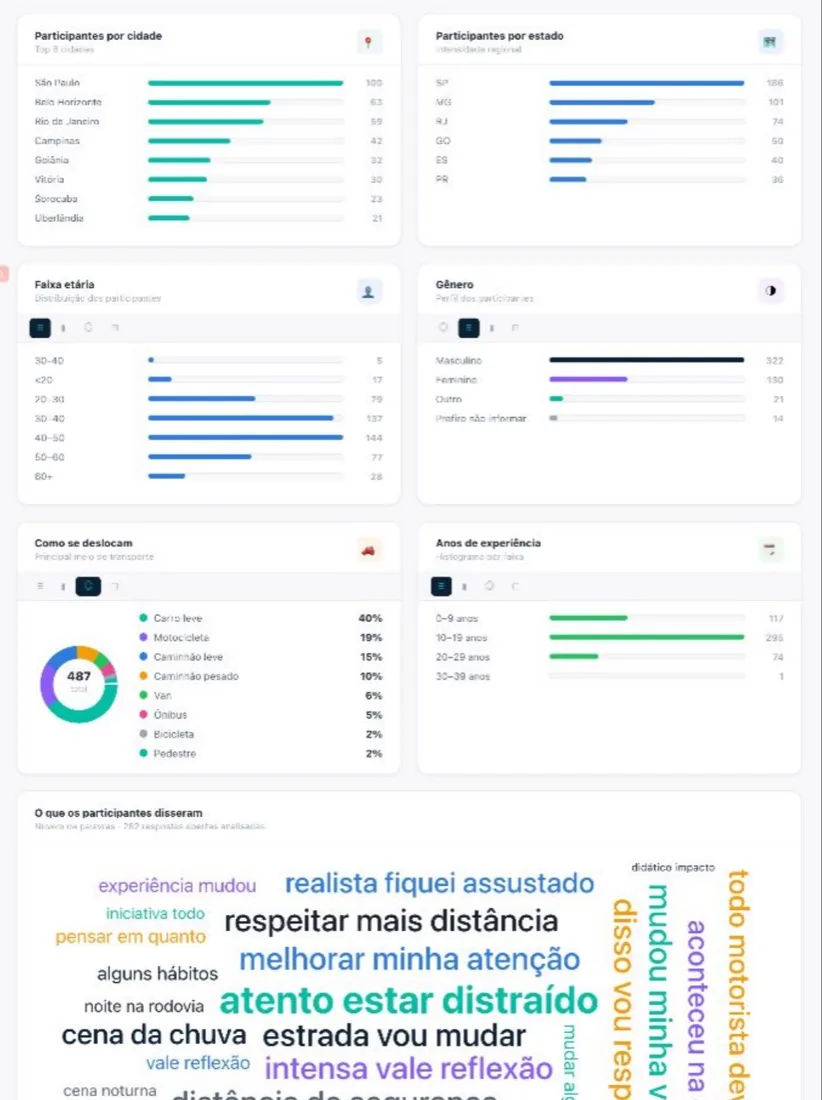
VIAS dashboard.
VIAS in the field at Paving Expo 2026.
In September, Oz brought the impact simulator and the VIAS survey to its booth with Ecoposte, at Distrito Anhembi, in São Paulo.
31%79%
of participants said they felt fully able to resist the phone at the wheel, before and after the experience.
106 respondents at the event, in a single collection, without D15.
A 12 month program, not a one-off action.
VIAS follows the road safety calendar, from Yellow May to National Traffic Week, and turns each cycle into learning for the next one.
- 01
Tailored experience
Virtual reality script and scenario produced for the road, the audience and the risk.
- 02
Equipment and training
Simulator and headsets delivered, with your team trained to run the actions in the field.
- 03
D0 and D15 survey
Collected via QR code and WhatsApp, no app.
- 04
Live dashboard
Results by audience, region and unit, updated after every action.
- 05
Bimonthly committees
Data review with Oz to adjust message, audience and location.
- 06
Executive report
A basis for ESG, health and safety and compliance, and to defend next year's budget.
International precedents.
Behavioral measurement is already standard in global road safety programs. VIAS brings that standard to the Brazilian reality.
Ford WheelSwap
Europe
60% self-reported behavior change after two weeks, according to Ford.
Toyota TeenDrive365
USA
20 thousand participants in 9 markets.
National Highways
United Kingdom
Virtual reality as education infrastructure since 2017.
Oz's road safety operation.
Since 2009, Oz has created campaigns, films and immersive virtual reality experiences for the largest highway concessionaires in Brazil. By closely following the sector's urgency, Oz built VIAS, the missing measurement layer.
- 2009
- In the sector since
- 18
- Simulators in the field
- 8
- Concessionaires
- 14
- States
Meet Oz
The VIAS Program is part of Oz's road safety work, alongside campaigns, films and experiences for concessionaires across Brazil.
Concessionaires that trust Oz


Frequently asked questions.
Does VIAS reduce crashes?
VIAS does not promise a reduction in crashes, which depends on engineering, enforcement, education and many other factors. What it delivers is a measure of the educational action's effect on the risk perception, self-efficacy and declared intention of participants. With that data, the next actions become smarter.
Does VIAS measure behavior?
It measures risk perception, self-efficacy and declared intention, with a documented and traceable methodology grounded in established behavioral theories. It is not observation of behavior on the road.
Why measure at D0 and D15?
D0 captures the impact right after the experience. D15 shows how much of that impact remained two weeks later. The comparison between both is the Awareness Delta.
Does the participant need to install an app?
No. The survey opens in the phone browser from a QR code and takes less than 2 minutes. D15 arrives on WhatsApp.
Who is the program for?
Highway concessionaires, cities and traffic authorities, and companies with fleets or teams that drive for work.
Can we start with a pilot?
Yes. The program can start with a pilot on one stretch and grow in cycles. The proposal is built around your audience, road and calendar.
Shall we measure what your next action changes?
Tell us your road, audience and calendar. Oz will build the VIAS Program proposal for your operation.